Better yet, don’t avert your eyes. You need to see this. The pictured Amigos seem of a different, more innocent time. See their wackiness. See them smile. See them full of life.
But each Amigo, especially Amigo Ag and Amigo Cu, look like they were bracing for something in this picture. Amigo Au is just charging forward, blissfully unaware, although he too has got some minor issues. The macro Amigos are in a chain that goes like this… Au → Ag → Cu. Counter-cyclical gold with limited industrial utility, semi-counter, semi-cyclical silver and completely cyclical copper.

We already took at look at the simple monthly chart of the gold price and here we’ll take a look at the daily futures price, along with daily and monthly views of silver and copper. Click the charts to enlarge for a clearer view.
Gold has lost the daily SMA 200 and not been able to take it back. This came after a failure of the SMA 50, which itself came after a negative divergence to price by RSI as noted in the last Amigos post on March 12. Odds have increased of a test of major support in the mid to upper 1300s.

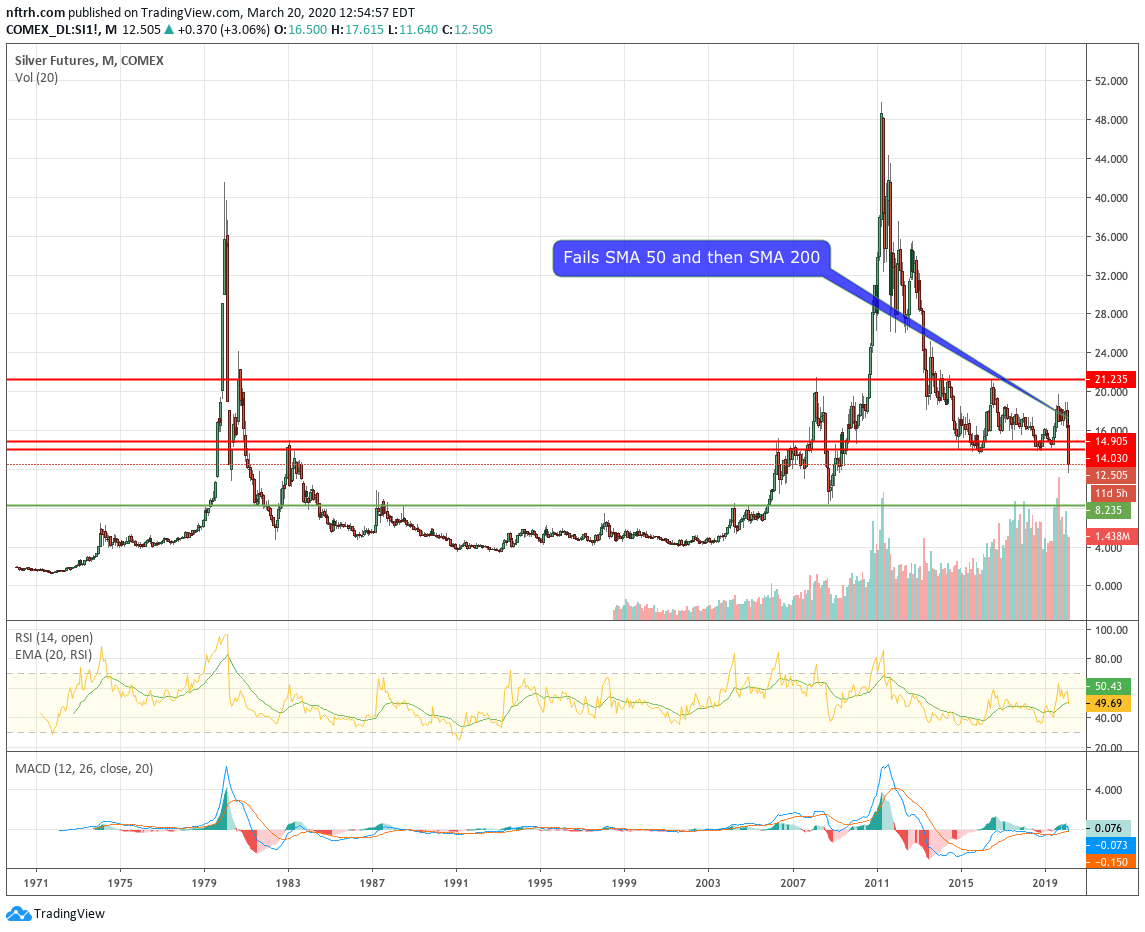
Silver did what silver periodically does, which is to get shot out of the sky like a clay pigeon. The crash has been precipitous after we noted the moving average failures last time (link above).

Silver monthly is where the action is, and it resides in the 8s, which is the next major support area. Doesn’t mean it has to go there, but doesn’t mean it won’t either. In fact, technically speaking and barring a reversal in March to negate the monthly candle, the odds are it will.
Copper… ah Doctor Copper. Why didn’t I take you and your deflationary Air Gap more seriously and tout the global economic collapse to the world ahead of time, like months or a year ago, whenever I started flogging people with it Amigo update after Amigo update? Because I don’t make dire predictions, I just show pictures on charts and let people evaluate future potential on their own? Okay, sounds about right.
Well anyway, this is disgusting. I thought I may have been injecting too much hyperbole talking about 2.20/lb. for copper but…

…it has already dinged below 2 and if it does not hold this snap back above last ditch support the chart shows nothing but hot air – a mother of air gaps – down to 1.38 or so. It’s just what the chart says and it is not good. Not good at all.

Bottom Line
Gold must remain intact, which it would do even if it tests 1378. Silver must bottom and one day start to lead gold and copper must bottom before inflation and thus the inflated economy starts to gain a pulse. Right now it appears to still be relative early days.
Subscribe to NFTRH Premium (monthly at USD $35.00 or a discounted yearly at USD $365.00) for an in-depth weekly market report, interim market updates and NFTRH+ chart and trade setup ideas. You can also keep up to date with actionable public content at NFTRH.com by using the email form on the right sidebar and get even more by joining our free eLetter. Follow via Twitter @NFTRHgt or StockTwits.