Back in December we had an update highlighting the bullish setup in SSRM.
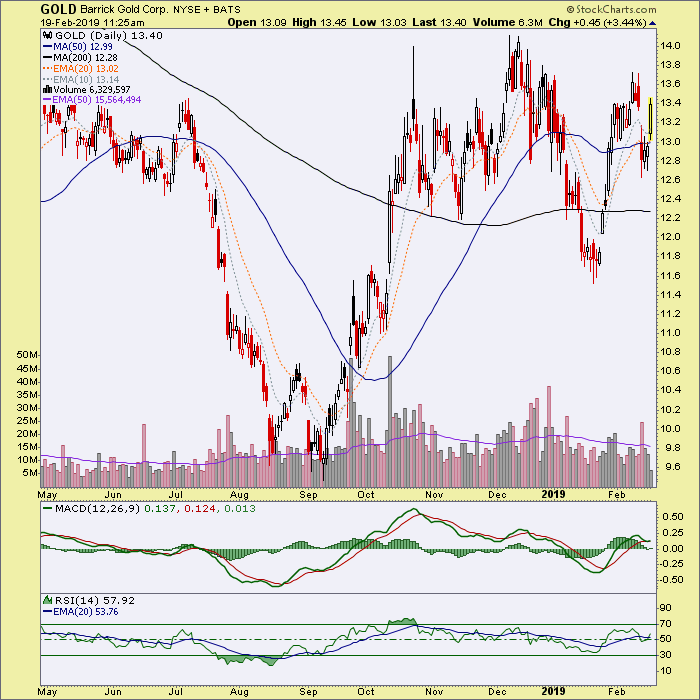
In this week’s report I noted some displeasure with the daily chart of GOLD. That was due to its proximity below the 50 day moving average. Well, one bullish day for the sector and voila, it’s back above. It is filling a gap so to be a little firmer about this stock we’d like to see it make a new high for February.
But the main reason for this update is GOLD’s similarity to the weekly chart setup that SSRM was in when first highlighted. Much as SSRM was highlighted before its breakout, so too here with GOLD. Just as I bought SSRM before the breakout, I already hold GOLD.
This update is simply to advise the measured target on this senior gold miner should the noted resistance area get taken out. There is a gap below 12 that is of minor concern, but if the daily chart above holds above the SMA 50 we can watch for the weekly chart’s breakout potential.
A reminder that chart based NFTRH+ updates are technical trade setup ideas, which may not be revisited as the technical parameters are already noted. These updates are meant as a starting point for your further research if interested. I will not personally buy every item highlighted and will sometimes sell (ref. Trade Log) any item that I do buy below target (assuming I’ve not stopped out or sold for some other reason) as I often do. Also please be aware that I am not a fundamental stock analyst. Due diligence is your responsibility.

