We covered the daily technical situation in NFTRH 529 but it can’t hurt to review again for those who are not just holding for a new bull market (and all the volatility that is sure to entail). In short, traders would want to be aware of the first significant resistance levels.
As you know, we have been ramping up a bullish fundamental view slowly but surely for months now. But the technical aspect is its own animal.
Let’s start with HUI using daily, weekly and monthly charts. Daily HUI has the gap at 160 as its next objective and then the SMA 200 (currently 163). After that is thick resistance at 170. Even though the sector view is becoming bullish there will be reaction points along the way and 165-170 seems a handy area for some of that.

The weekly chart gives another view of the current resistance at 160 and the next level of resistance at 170.

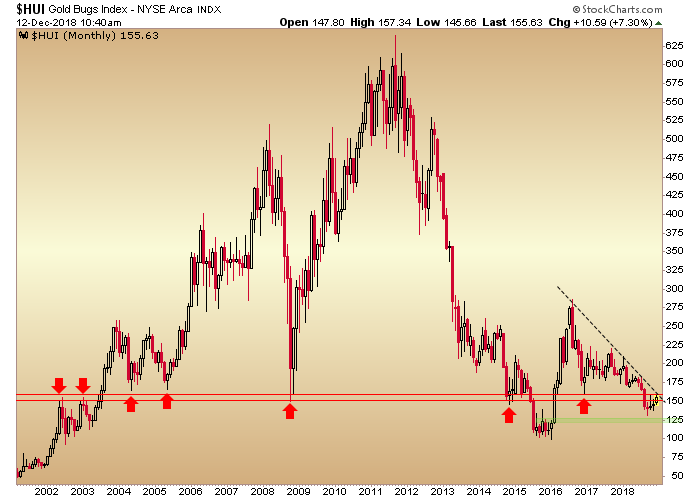
The monthly chart dials current resistance areas back to the beginning of the previous bull market and shows a trend line (dashed) that could attract some attention if/when broken.
Gold’s daily chart shows a break above 1240 resistance that was being tested as of yesterday’s close. Normally we’d say have caution at the SMA 200 (1260), but assuming the 1240 test is successful we note that there is not a lot of lateral resistance until 1285 or so.

Silver has resistance at 14.95 and if it can clear that level and hold it there is minor resistance at 15.25 and then not much more until the SMA 200 (currently 15.54) and the lateral shelf just above it as shown.

Just a little pictorial view of the precious metals sector’s progress.