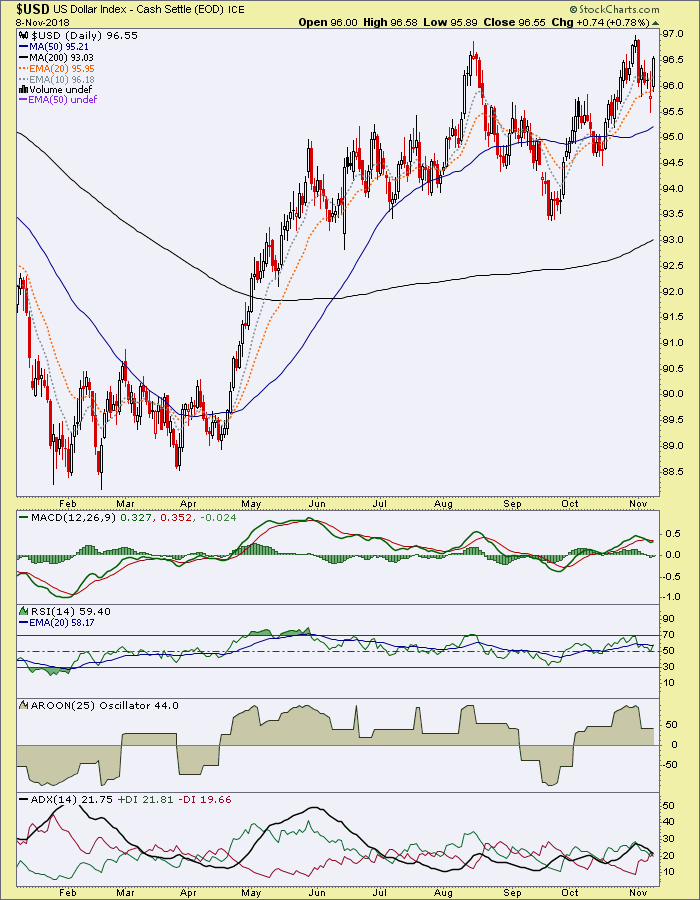
The Fed did nothing that was not expected, yet the US dollar regained its vigor as if market players actually had doubts about whether or not the Fed would remain firm. It would take a lot more than the October pullback to get them off their stance as longer-term interest rates (from 2yr to 30yr) guide them upward.
So USD regained its bullish look after pulling back a bit. Generally the SMA 50 is and has been supporting it since mid-summer. USD is the pivot to so many global trades. Recall the longer-term view of USD has been bullish because the 2018 rally started off of key long-term support at around 88 after making a secondary low in 2011 that looked like the beginning of a cyclical bull market.
So we have opened up a seasonal view that could see an extended bounce for November into December in the US stock market. Well, of course the market is testing that now during FOMC week. SPX has a gap below the SMA 200 and if it wants to really put on a test it can drop to that area to fill the gap. It could even drop lower to form a right side inverted shoulder to create a really strong bounce pattern. Or, the thing could just fail considering how many sectors – per the most recent update – are still below technical resistance points.

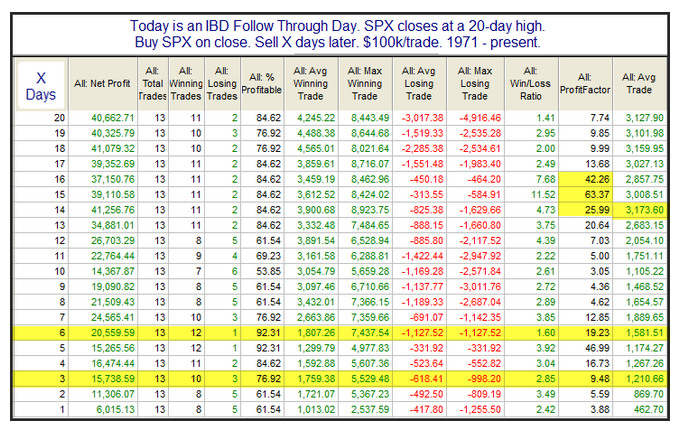
Side note on SPX: Our quant friend Rob Hanna’s data says bullish on the short and intermediate-terms based on historical facts, after a ‘follow through’ day.
The World looks like it may not reach the bounce target of 46 if USD remains firm (as we’ve shown, they have been largely opposed). It did get close, however. Yet it also has the potential to form a short-term Inverted H&S, although that is just pure speculation at this point. If it were to do so it would probably be propelled to the declining SMA 200 currently around 48. As for going bullish, this would have to clear 48.50 to 49 in order to break the downtrend. Global markets on balance need the US dollar to weaken, and that is not the preferred technical indication.

Commodities continue to weaken with their driver, crude oil. They remain of no interest at this time, much like global stocks, in the face of a strong USD.

What is of interest (for gold bugs) is crude oil (and other commodities, materials and resources that feed into gold mining bottom line cost structures).
We have noted that WTI Crude has broken below the summer lows and that constitutes a technical breakdown. Now, this thing is getting very oversold so I would expect a snap back rally at some point. But as with many areas of the stock market, technical damage has been inflicted. Key resistance is in the 65-67 range.

Finally, the area that cannot get out of its own way. The area that frustrates the hell out of everybody, and the area that could get really bullish if and when the stuff above turns for the worse in a way that is obvious to a majority.
Gold too has bowed to the mighty Oz and turned down during Fed week. MACD is on a little roll over but the SMA 50 has recently begun to rise, so a test of that marker will be key. The SMA 50 corresponds with the lateral support of August-October cluster. Gold needs to hold the 1210 +/- area to avoid losing short-term bottom potential.

Silver continues to look worse and should hold the September, October and November lows to avoid breakdown.

HUI aborted it’s latest bounce to drop and test the SMA 50. A gap is just below. It could fill that gap just below at 142.82. A drop below the October 31 low of 141.48 would open up a test of the September low or more likely, new lows based on the pattern. If that happens it would be important not to personalize it. Finding a real bottom and starting a real bull market was never going to be easy. Assuming the other pieces (fundamental considerations like Gold/Stocks ratios, Gold/Oil and Gold/CRB) fall in line we still have to deal with the poor near-term seasonal and investors’ perceptions (this is where the inflationists that bought for the wrong reasons – like “death of the dollar” for example – would sell for the wrong reasons, as in Q4 2008). PATIENCE.

Bottom Line
US Stocks: The ‘quant’ historicals and the short-term seasonal are positive. Many sectors remain technically compromised. There is enough evidence for both bullish and bearish cases that I will plan to manage with cash, which for the time being is a ‘can’t lose’ option. As often noted, I am not an accomplished bear trader as I don’t have the stomach for it unless the setups seem compelling. I’d probably continue on trading long and short on a case by case basis, but always with the idea that currently high cash levels can and probably will get higher.
Global Stocks & Commodities: It’s pretty obvious that the strong US dollar applies the pressure. As with some US sectors, global stocks and commodities probably need the US dollar to roll over in order to rally. Now, it is fitting that USD is playing ball with the FOMC this week. Maybe as the dust settles and new inputs hit the macro the USD can pull back again. But for now, it’s bullish and this stuff is not.
Precious Metals: This stuff is not bullish either and yes, it’s the firm USD doing the damage. But again as just one example, if the firm USD is driving down gold but doing so less intensely than commodities (incl. oil), the setup for a real buy would be in play. Here is what I mean in visual terms; the gold/oil ratio has spiked. It’s probably due for a rest, but that’s a good start.

I am not interested in the gold sector because I am a masochist. I am interested in it for rising fundamentals as gold, silver and miner prices remain under pressure. Assuming that Au/Commodities, Au/Stocks and Au/Currencies continue to play ball, a buy is setting up. It could yet be a multi-month process looking forward as the sector tends to set lows in December or January.