Now that the supposed decision (there was no decision) by FOMC is behind us the market can get on with its course for the summer. Here is a chart based update with a few thoughts. The main theme here, other than the daily chart status of each item is how they potentially tie in together for a macro theme.
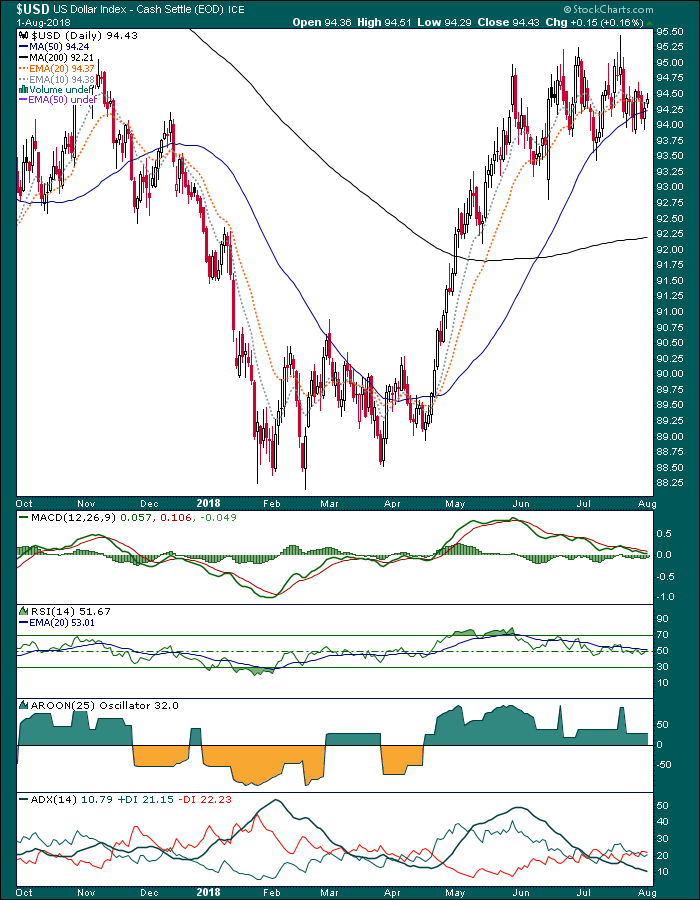
USD is taking its time in either rolling over or moving to new highs after consolidation. This morning’s pre-market activity puts Uncle Buck at 94.77, which is still within the consolidation structure. To review, I am fairly bullish on USD beyond the potential for a pullback to test the SMA 200 (black), as its rally came from significant long-term support. The longer it hangs here at the SMA 50 more it is a candidate to simply work off its overbought status in that manner as opposed to dropping to the SMA 200. But let’s remain open minded here as long as the consolidation continues.
Now, many people think bullish USD = bearish gold. But if risk ‘off’ spirits were driving the buck and bond yields were of certain alignments, gold need not be bearish in the face of a firm dollar. Again we can cite Q4 2008 as an extreme example, when the precious metals bottomed and turned up against a strong USD.
Inflation expectations are muted, the 10-2 yield curve has been bouncing for the last couple of weeks (and is positive biased this morning, although still in its major flattening trend) and if stocks were to be sold off (they are playing along, in the red this morning) I think that bonds, USD and gold to varying degrees and times, can gain bids.
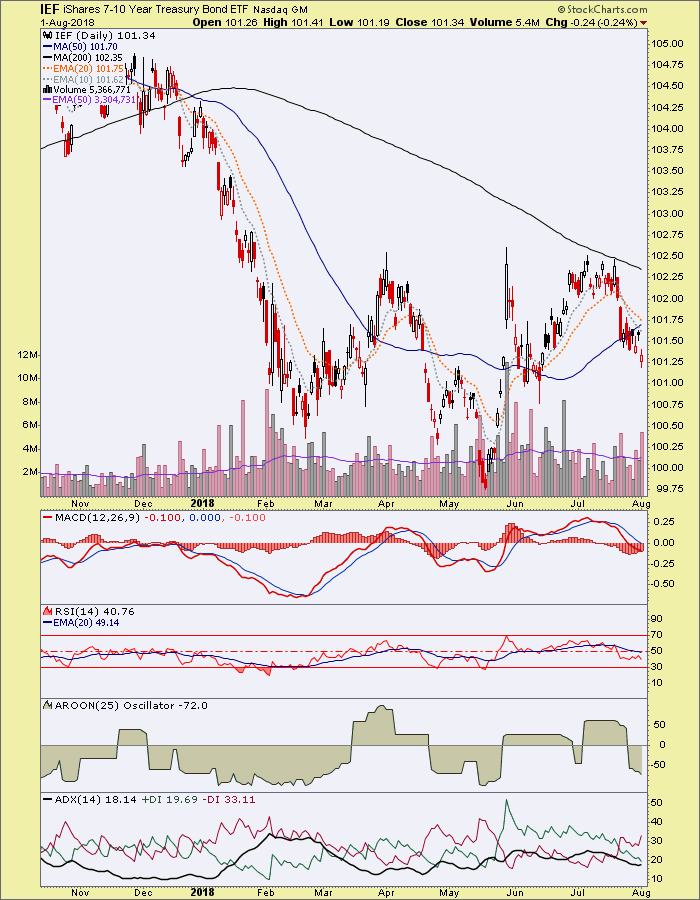
Meanwhile, the Treasury bond fund most correlated to the 10yr bond has dropped with the recent run up to the Fed’s SOMA bond maturity date of July 31. But it is in a potential Inverted H&S pattern and also note the post 10yr & 30yr Bonds Still Contrary Bullish from July 31. The point was that sentiment, by Public Opinion & CoT is still bullish for long-term bonds. From that post:
The above seems to fit with sideways-going inflation expectations (ref. TIP/IEF, TIP/TLT and the 10yr Breakeven Inflation Rate). It could also fit with a market correction scenario as improbable as it may seem to a majority (still convinced yields will rise), and a liquidity event, if that is what is ahead, could put the herds into long-term bonds temporarily in a flight to risk ‘off’; Fed QT or no Fed QT.
The bottom line on the above is that if risk goes ‘off’ gold will likely be just fine, given its bombed out sentiment (contrary bullish) profile, firm USD or no firm USD.
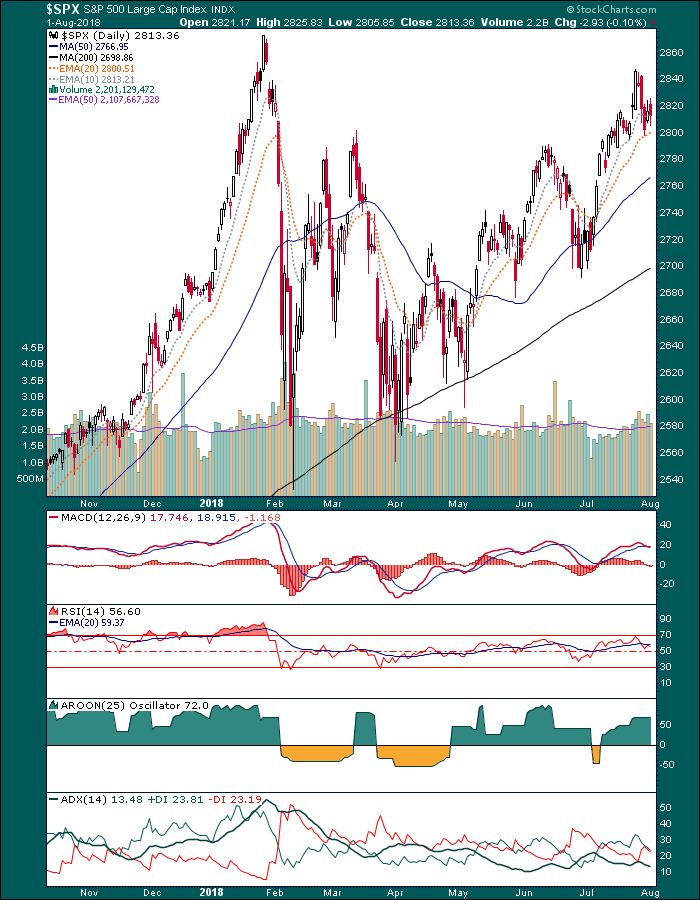
As for stocks, at this moment the SPX pre-market would project an open at 2798. Is that a little bear flag that has formed over the last 3 days? SPX is trying to bounce, in this little flag, from lateral support around 2800. Here is a screenshot from NFTRH 510:

If the flag breaks down we’d be on watch for a breakdown of the 2780-2790 support area, then the SMA 50 (blue) and most critically the SMA 200 (black), which is right at a decision point of maintaining a higher low or losing it. Unfortunately, if you are going to go by the book you cannot just click your heels, say “I want it to be bearish” and magically have it be so. It is a process of milestones. The 1st is this little bear flag. 2nd: 2780-2790 lateral support. 3rd: SMA 50. 4th: SMA 200 and a lower low. That last thing would be a rally (and uptrend) killer. Meanwhile, all trends remain up and hence, bullish.
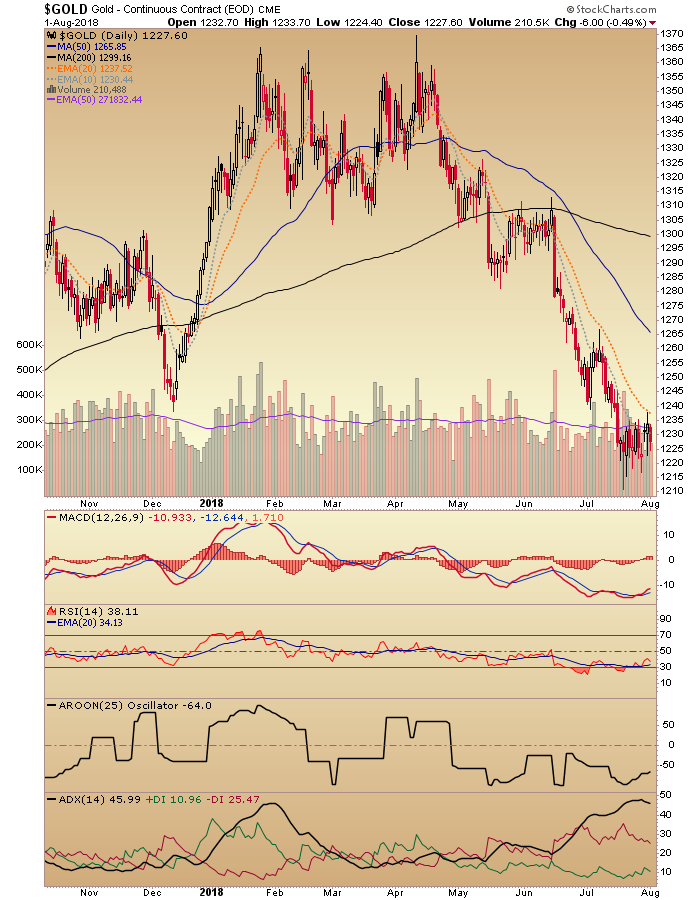
Finally, the “Golden Goodies” to quote some cartoon-like analysis. Gold has been dope hammered precisely at a time when its seasonal turns positive, its sentiment is bleak, its CoT is constructive and many in its own “community” are guiding gold bugs lower (“Golden Goodies” guy excepted). We should not get bullish beyond bounce potential just because of the above conditions. But if we can add in a macro fundamental underpinning like risk going ‘off’ we just may have something here. Hence, we watch stocks and bonds per the above.
Gold made a lower low and killed its ‘higher highs and higher lows’ uptrend. That is what has the gold chart guys all abuzz. Sure, it is not a positive condition, but I maintain that you don’t chart gold in a conventional way and expect it to act like other assets. The fact that it is hated and deeply oversold mean more to me than the lower low. Gold is not even an asset in my book; it is a counterweight and it is monetary stability. Gonna chart that like the NDX? Like Oil? It’s raw emotion.
Now, until gold actually does something I am not doing much with respect to adding more positions. I am sitting there balanced and waiting (mostly for the macro to either go risk ‘off’ or confirm risk is still ‘on’); at which point I’ll either lean ‘off’ or ‘on’.
With the update above I am hoping that I was able to illustrate the interconnected nature of the situation among these assets. Please let me know if you have any questions or critiques. To my eye, we are at an important market juncture.