The stock market is very overbought in general. There are certain sectors (Biotech, Telecom, etc.) that have gone in the opposite direction and certain indexes/segments (Small Caps, for example) that have been consolidating downward. But the headline indexes are flat out overbought when viewing their distance from the 50 day moving average (blue).
SOX is further from the SMA 50 than it was in May, before the last correction came out of nowhere.

NDX in a similar situation to the pre-corrective one from May.

DOW and SPX as well are very extended as far or further than they ever get from their 50 day averages.


You know how the stock market goes; a TA talks about overbought and the thing tacks on 200 points on the Dow. That is especially how a manic and overbought market goes. But I am not playing that game. The market is vulnerable and in my opinion, greatly in need of a pullback to test the 50 day averages, at least.
In the mirror, we have the gold sector. Just as surprises can come out of nowhere in stocks (just take a look at the May-June corrections in SOX & NDX) they can come out of nowhere in the other direction for the counter-cyclical sector. We have reviewed the sorry state of the gold sector’s fundamentals (gold vs. commodities and stocks and the yield curve have been drubbed) but we have also noted that barring a Q4 2008 style crash amid rapidly improving fundamentals, the funda are mostly likely going to look like crap at the bottom. This is where TA, sentiment and even seasonal aspects come in.
Taking the last one first, we have noted that seasonally gold can grind out a bottom (on average) in December or January. We are coming toward the window.
Sentiment is not overwhelmingly positive on a contrarian basis, but it is much more healthy than what is going on in the stock market. At last reading the Commitments of Traders data for gold and silver were not indicative of a real, long-term trend change.
As for the TA, let’s take a quick review of the daily charts of HUI, Gold and Silver and recall that the monthly views are and have been constructive and the daily/weekly noise occurs within that.
HUI retains its bounce stance. We have noted that the previous 195-200 support is now resistance. So much as I’d like to say ‘whee, the market is vulnerable and if it corrects gold stocks are on their way!’ I cannot say that.
First of all, stocks may consolidate, not correct and even if they do correct, the trend is up and it could be another healthy correction (like a test of the SMA 50s). So for now we should stick with the original plan for HUI, which was for a bounce potentially to 195-200 resistance zone. At such time as it would break through there I’d be happy to call it something more, but for now I want to take all markets in steps, not overlaying wishes or desires. Just hard data points.

As noted in NFTRH 472, gold has been remarkably firm given the massive risk ‘on’ trades going on out there. It has held the SMA 200 with no problem so far and could be preparing to bounce. The key level for gold to get really interesting however, is to make a high above the October high, which was 1308.40.

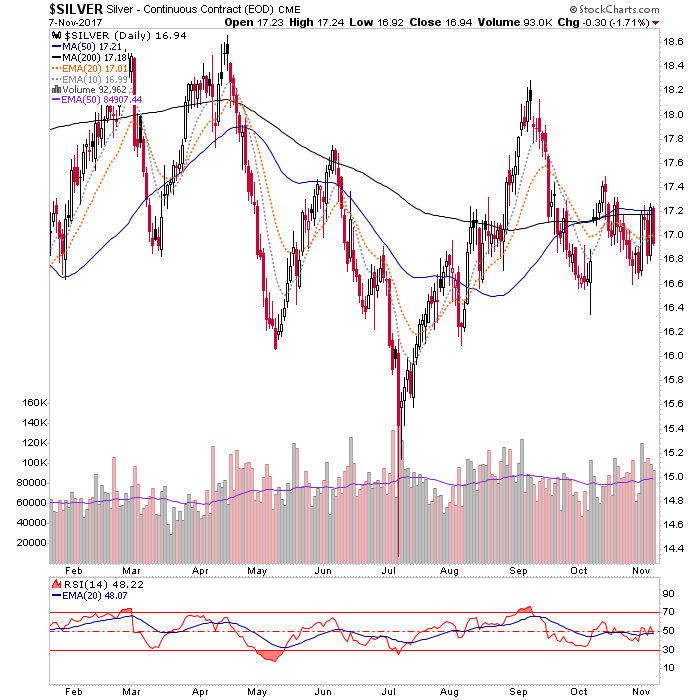
As for silver, it is dwelling below both the SMA 50 & 200. A rise above those could see silver lead a bounce. Silver would not indicate more than a bounce unless it gets above the early September high of 18.29.
Bottom Line
There is the potential for counter trend moves in both stocks and precious metals. But at this time if this plays out it should be viewed as a correction in stocks and a bounce in precious metals. Those are the technicals of the matter, unless the macro fundamentals offer us reasons to change that view.
Meanwhile, on a bigger picture positive view of the precious metals, we have still-constructive monthly charts and a December/January seasonal low that often comes about.