A few random charts from a segment that is probably not as sexy as some others (okay, you got me… there is nothing sexy in NFTRH because nerds are not sexy)…
Leading off with the mature gentlemen in ascots and smoking jackets with the typical Dow Theorist calling out to Mable in kitchen… “Darling, would you mind greatly holding the Beef Wellington for a short while? I think I have a signal that may finally work and I need to tell the world about it… “
The Dow is around new highs (again) and the TRAN is diverging (again).

This is an interesting one to be added to the plethora of reasons that the S&P 500 could have the legs kicked out from its table this fall (now including Tom McClellan, with the #7, which I was aware of but completely and purposely ignored due to about a million other caution indicators I’ve been working with).
Anyway, we still have the 2007 analog in play with the cyclical indicator known as Consumer Discretionary vs. Staples. On this monthly chart the black candles often tend to be reversal candles. Check the Dome breakouts in ’06 and ’07. Check August 2017’s candle. This is a low priority indicator and sure, the Domes are somewhat open to interpretation, but here it is anyway. I would say that if the green channel were to break down, we’d have a pretty strong bear warning.

But what do we have here? What we have is a cycle indicator still saying “all’s well bulls, come out and play”. I use PALL/Gold as an economic cross reference and it shows everything firm and on an up cycle. Copper/Gold is similar (cue the old saying about the market’s copper roof… the old leaky one has been replaced) and Silver/Gold does not yet indicate any sort of market dislocation or liquidity event (although it is still summer silly season and da boyz isn’t back from da Hamptins yet).

With respect to the above, let’s cue the September seasonal again (courtesy Sentimentrader) and remember that we are targeting September (probably 2nd half after dems boyz settles in) and beyond…

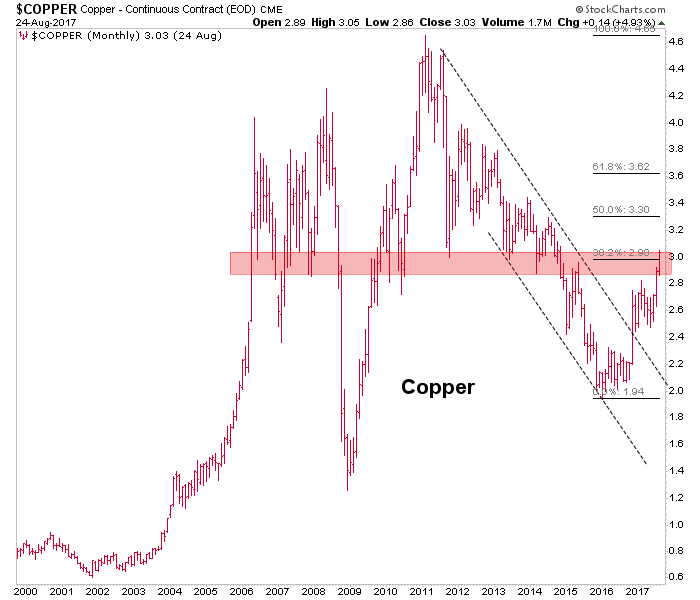
As for copper above, how about this monthly view that was created back in 2016 to show copper’s bounce limits. As noted in an NFTRH update the other day I actually only remembered this chart because I stumbled over it. The 38% Fib retrace is in the books and the good doctor is at notable long-term resistance. Much like with the stock market, which has acquired its big picture upside measured targets, copper’s date with the 38% Fib does not need to be a stop sign… but it is also no longer there as an upside objective.
As for leadership, SOX leads NDX, which leads SPX… SOX/NDX has been going side ways to either temporarily correct the momentum or break down from the channel. Answer upcoming. NDX/SPX has faded and may have inserted a double top. SOX/SPX is losing momo, RUT/SPX has broken down and is in an intermediate-term downtrend channel. Finally, the Medical Device sector, on which we were so constructive in late 2016 and early 2017, continues to struggle after a double top vs. SPX.

A weekly view of various sectors vs. SPY. It’s pretty self-explanatory with no real need for words by me.

Finally, Europe continues to hold support vs. US, China 50 has made a bull move with only a higher high to the 2016 high needed to set this off on a long-term uptrend. Toronto and Russia are brutal and non-actionable on a ‘vs. SPY’ basis. And EMs, on which I have been brutal over the last several months (after catching the bottoming patterns on it and Asia, ex-Japan :-( over a year ago) is now making a higher high to 2016. If that holds up (i.e. not a whipsaw) we could look to China, Europe and other global markets in a bullish way in 2018.

Again, it’s just a few charts and interpretations from a report that features this stuff and a whole lot more. They say the markets are confusing these days and I agree with them. But to me, the only way to un-confuse them or at least stay on the right side of things is to dig up as many reference points as possible across so many sectors and markets and distill probabilities from those reference points.
My current view, based on the little exercise above and all the other work to date is that we are still in a summer way station, but that significant pivots are due by Q4 2017. End of the bull? Why go there? Even a bull market correction should be of trade-able magnitude. I remain very cashed up, much more long (including quality gold/silver stocks) than short and positioned for a firming US dollar).
Subscribe to NFTRH Premium for your 40-55 page weekly report, interim updates and NFTRH+ chart and trade ideas or the free eLetter for an introduction to our work. Or simply keep up to date with plenty of public content at NFTRH.com and Biiwii.com. Also, you can follow via Twitter @BiiwiiNFTRH, StockTwits, RSS or sign up to receive posts directly by email (right sidebar).