In NFTRH 434 (2/12/17) we noted the key pullback support levels for the HUI Gold Bugs index. These were 209 (daily EMA 20), 200 (weekly EMA 55) and 195 (convergence of daily SMA 50 and lateral support). Let’s take a checkup on things 1+ weeks later.
Daily HUI hit the first pullback level today (209.01, before bouncing back) and continues to grapple with the EMA 20 (orange dotted, now up to 211.89) after fading from the clear resistance level around the SMA 200. The SMA 50 (blue) has risen to 196.36.

The weekly EMA 55 remains at 200.

There seems to be some level of negativity out there, but that seems to be mostly people getting worked up about short-term moves (i.e. day trading). I think there is a decent chance Huey drops to the weekly EMA 55, toward which the daily SMA 50 is now rising. So 195 to 200 still looks good.
The sector continues to be in ‘bounce only’ mode as it never cleared the November highs. Fundamentals are not complete and this pullback – whether mini or something more maxi – will tell a lot. I remain lightly positioned in a few items (having taken the profit in RGLD today) and may even add a little of the DUST bear fund (not recommend for most people) for a quickie.
But with a wide world full of markets out there the sector remains one not to be obsessed over until it either provides a buying opportunity amid improved fundamentals or creates a higher high to November and holds it. Even then, we should not obsess over any sector. It’s just that you know how the bugz get when things get exciting, both to the up and down sides.
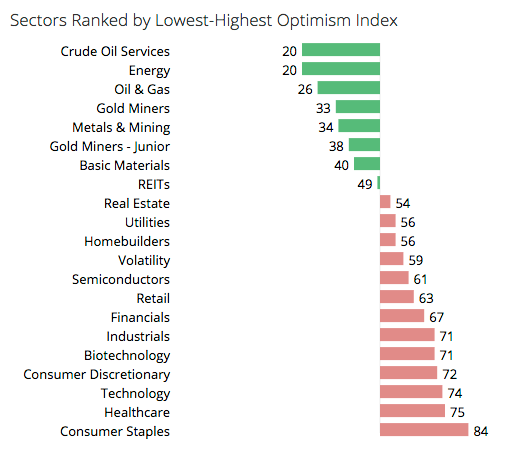
One reason not to expect a big downdraft is the muted to apprehensive sentiment noted above, as also shown in this short-term sentiment graph for various sectors. I have found this to be less than reliable if taken literally, but it is better to have the miners showing green than red.