NFTRH 430 wondered about how the miners could be looking good and still-bullish and the metals were much less so. So I think an in-day snapshot is in order because if the metals go technically bullish too, then as noted in #430, we’ll go bullish right with them.
Here is the GDX chart we used a while back to gauge the rise to the 50 day moving averages and then the breakout of the channel. Today it is breaking above the little bullish looking consolidation flag. Reference per HUI daily in this week’s report that this is coming above key support (equiv. to HUI 195). MACD, RSI and AROON are all good. The most important point now is the November high because if GDX could get above that, the correction would be indicated to be over (i.e. this is more than a bounce, as we have been calling it).

GDXJ has just crept above its downtrend line from August. It is bumping its head against the SMA 200, which is very key. If GDXJ can grind out a hold of 38 it would be very constructive. Looking ahead, the November high just above 40. That would be important.

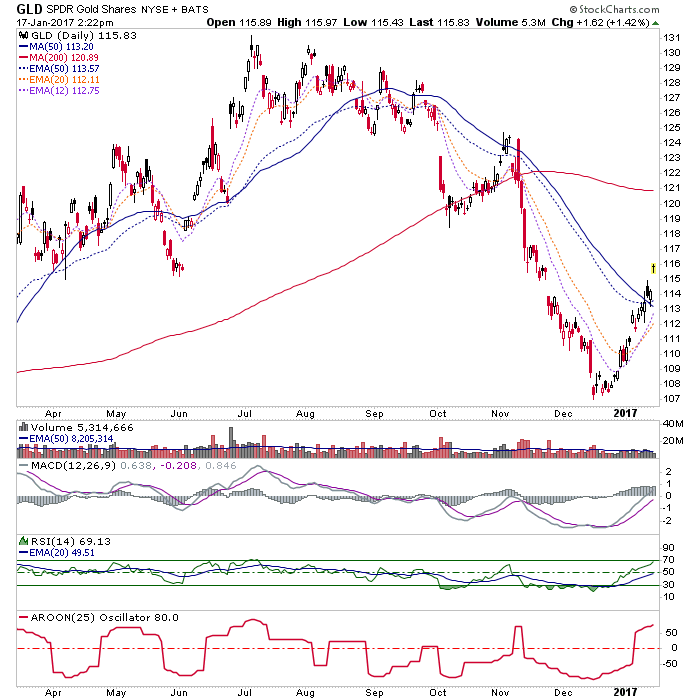
GLD is breaking away from the SMA 50 area but I don’t love that it gapped on anti-dollar comments by the new president.
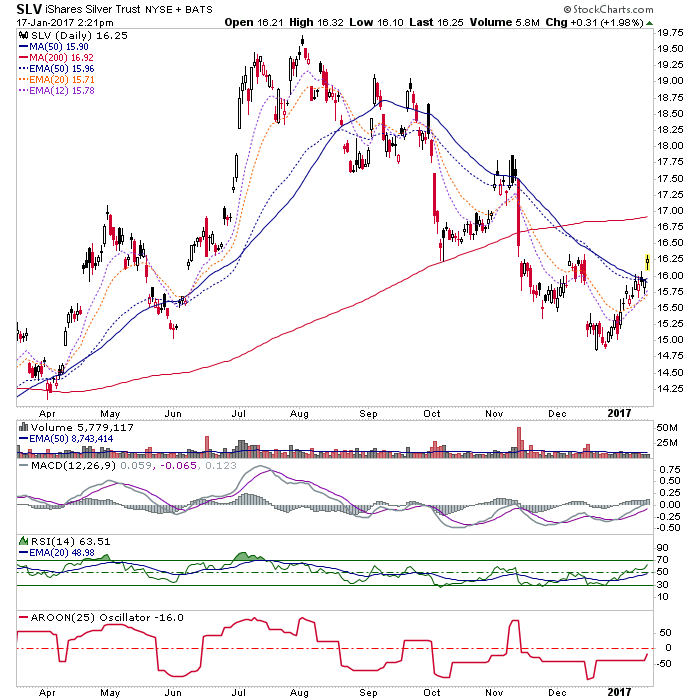
SLV is also breaking above the SMA 50. It has done this a few times since the correction started. I would see a rise above the December high (it’s right there) as a point to sit up and pay attention. AROON has lagged the other indicators, but the trend would change to up if the December high is taken out and held.
The weekly view of gold and silver show resistance at 1200 and 17, respectively. So people could get excited about this. But note that gold is below the EMA 70 (1231) and silver is below the EMA 55 (17.19). In real time the metals are trading at 1215 and 17.16, respectively. So they can still be considered below reasonable resistance.

Bottom Line
The precious metals complex is nearing the point where it will turn a bounce into a new bull phase or it will fail, as gold and silver are filling gap downs from the end of last year. The sector has not yet indicated a new bull phase, yet if it does we have some parameters above to guide us on that. As it stands now, the complex has gotten to a point where bounce players (traders) should be thinking about taking profits. But I continue to find nothing bearish in the GDX chart. So we’ll see what the miners are up to and if they are leading something.
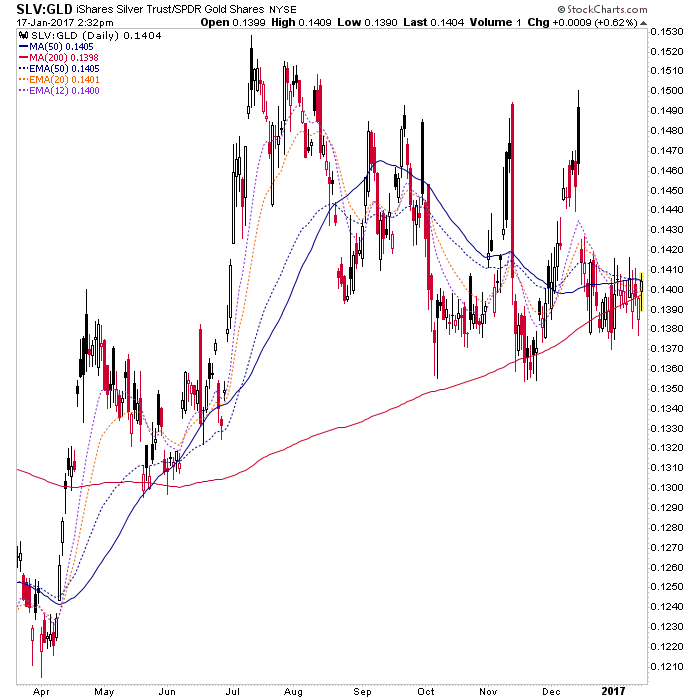
Separately, Silver-Gold ratio is still going sideways…
GDX-GLD ratio is grinding the 200 day moving average.
