Even in bull markets the corrections are brutal. That is because this is a relatively small sector subject to relatively large hype. When the gold sector gets sharp pullbacks the sentiment reactions ping to bearish but are fleeting. When it gets a real correction, the reactions do not complete until the sector is completely cleaned. By that I mean that all the forces behind the momentum that drove the previous leg must be bled out, no matter how long it takes.
Unlike those publicly ‘calling’ the sector every week (and in some cases more), I prefer to keep the future parameters and real time reporting mostly for NFTRH. Otherwise I just become part of the noise and would be one of many who are just too obsessed on gold, silver and the miners. Obsession is unhealthy.
But we did note in this public post on July 6…
Anyway, we first noted the bullish pattern (along with a bull flag on GDXJ) using this chart in an update (now public) on June 28 while waiting for the then existing target of 251 (which was based on longer-term charts) to be put in the books. We then assigned a new target based on this pattern, of 275 for HUI. That is a conservative measurement (because I am a conservative sort) and momo could drive it to 280 or even 290.
Well, Huey’s almost to 275. He’s also getting over bought and the sector risk vs. reward is not favorable in the short-term. But man, this is a bull market. Not based on this daily chart, but based on a bunch of indicators and longer-term charts we manage each week. This thing here? Pure panic buying momo.
After the correction began we also noted bounce target parameters within the new correction but had repeatedly advised that people should know who they are ahead of time (i.e. are you investor, trader or momo herd share puker) and proceed accordingly. Here’s a public post from September 9 and some thoughts clipped from NFTRH 411’s extended brain dump on the subject…
“So I have not yet decided what is right for me at this juncture. But the reason I am going on this ramble is to maybe inspire a few others to have a similar dialogue with themselves ahead of time. Just like the time to sell (if you have decided you are a trader) is ahead of the big downside, the time to buy (if you have decided you are an investor who is fundamentally engaged) is on the big downside. That is also known as buying gold bug angst as I often call it but is probably more accurately momentum players puking and black boxes stopping out.”
I am prepared to buy the running of the gold bugs, but fundamental engagement and patience also have to be in play. I am in no hurry yet because of what the macro indicators are doing at this moment. It all fits together in one big puzzle, you know. We’ll have an extensive subscriber update and make sense of this, as the dust settles.
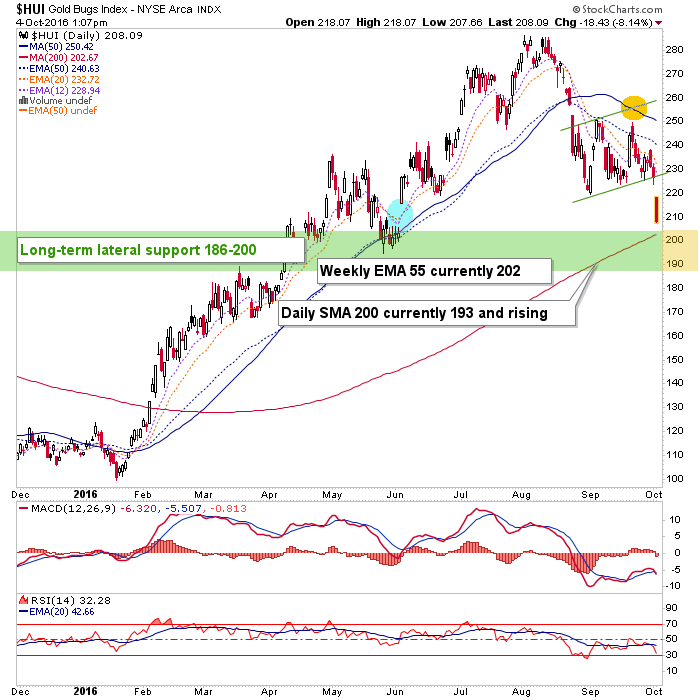
Here’s a daily chart we used in NFTRH somewhere along the line as we accurately managed the bouncing within the green (bear flag) channel. The support parameters were obviously noted well in advance of the worst corrective activity. I will not always be right, but NFTRH subscribers will ALWAYS get my best effort in defining the probabilities, and those have been that the “best support” is lower, in the zone noted below. That was harder to write when HUI was bouncing to 250 on hype momentum, but it is easier to write now. It is also easy to write that one shouldn’t assume it’ll just stop at 190 because some TA’s chart said so. There’s another gap way down around 180 or just below.
No one, except those that either blindly listen to gold pumpers or don’t care about TA, sentiment and market internals should be in the least surprised by what is happening in the sector. They need to have been thinking like predators, which I talked about on multiple occasions.
With the correction now on auto pilot, here is the weekly log scale chart [edit: oops, meant linear] we’ve been using in NFTRH to dumb things down and simplify lately. The sector was not going to even think about ending the correction until the EMA 55 is registered. It was the bull market indicator when it broke the chains of the EMA 55 and it always was going to be tested.

Here’s the log version.

So it looks like we should be paying attention. But again, there is more to the picture (macro fundamentals) that need to be reviewed as well. And that’s exactly what the next premium update is going to do. Meanwhile, consider the above a review of old material for NFTRH subscribers, who were prepared for what’s going on now, and maybe a bit of an obnoxious promo for public readers.
A. Hypothetical Reader: “Hey Gaah, yer soundin’ a little promotional there dude…”
Well hell yeah! I try to be honest at all times, unlike 90% of the financial realm. So I honestly think that this is a promo post. I know that nftrh.com readers are not stupid. Quite the contrary; I know that many of them are unbelievably astute. But on graduation day at Market Genius School they impressed upon us that on the occasions you’ve done well, consistently helped people keep perspective and retain/make capital, it’s okay to tout a bit.
Subscribe to NFTRH Premium for your 30-45 page weekly report, interim updates and NFTRH+ chart and trade ideas or the free eLetter for an introduction to our work. Or simply keep up to date with plenty of public content at NFTRH.com and Biiwii.com. Also, you can follow via Twitter @BiiwiiNFTRH, StockTwits or RSS.