We have been following the IHI Medical Device ETF for a long while now, as it acted as a bullish guide for the bearish broader markets. It was originally highlighted due to the bullish IHI chart and due to the sector’s tendency, per my experience in Medical Device/Equipment manufacturing, to maintain steady business during periods of economic weakness.
We first spotlighted Boston Scientific (BSX), a company I had done business with in the past. Next up was Medtronic (MDT). I held BSX for a long while and took a good profit and replaced it with MDT. With MDT hitting the lower end of the 84-87 target yesterday profit was taken there as well. This sent me looking for a next in line, which is CryoLife (CRY), a smaller company (and ‘story’ stock). It is richly (read: over) valued using today’s metrics, but the market views it as a growth stock. Personally, I am interested because of the chart and only as long as the market and/or sector are stable.
There was a (contrarian) positive and a (contrarian) negative in the news recently. The positive was automated research website Capital Cube twice noting “CryoLife, Inc. breached its 50 day moving average in a bearish manner” (unsurprisingly, that merely served to whip saw anyone who listened and acted as it is now above the 50). The negative was a pump from thestreet.com.
We’ll just go by the charts (daily, weekly and ‘vs. the sector’). One thing to be aware of is that CRY does not get a lot of volume (average 127,000 a day).
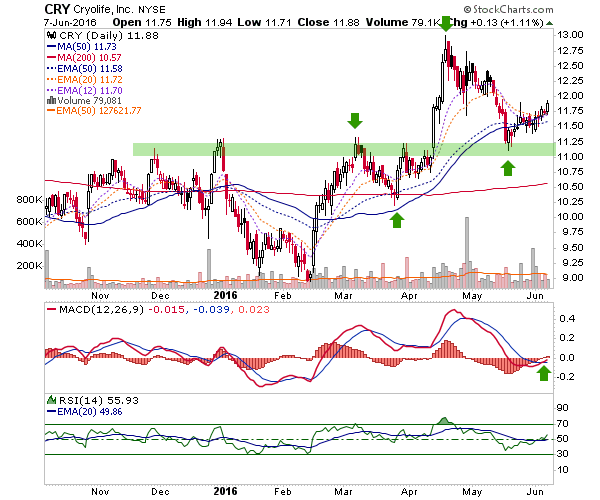
CRY daily made a bottom in February and has made higher highs and high lows since. There was a post-earnings downgrade and drop from 13 to very well formed support at 11-11.25. Now CRY is sticking to the SMA 50 like fly paper while MACD triggers up and RSI creeps above 50.
CRY weekly shows that a series of lower highs and lower lows was broken with the run up from February. It became over bought and was due for a pullback. The top level of support roughly corresponds with the SMA 50 on the daily chart above. I want to see this hold, but more testing of the lower support area cannot be ruled out.
Finally, CRY vs. IHI (sector ETF) is in a series of higher highs and higher lows by daily chart.
A weekly chart shows that it was a sector leader into 2014 and then got corrected significantly (as story stocks will do) for 2 years vs. the broader, more established sector during a time of broad market volatility. The trend in 2016 however, may be changing to positive vs. the Medical Device ETF. MACD is green but triggered down due to the hard drop since April.
Buy Target: 11.50 to 11.75.
Sell Target: A higher high above 13 or as suits individual goal.
Stop Loss: A lower low below the May low of 11.11 to suit risk tolerance. But note that CRY can decline to the SMA 200 (10.57) and still be in a series of higher highs and higher lows from February. It would mean that the May low (1st chart above) was not the final low. So that is a note for the more risk tolerant among us.
A reminder that chart based NFTRH+ updates are technical trade setup ideas, which may not be revisited as the buy, sell, stop parameters are already noted. They are meant as a starting point for further research if interested. I will not personally buy every item highlighted and will sometimes sell – without prior notice (because this takes time and resource away from NFTRH’s main functions) – any item that I do buy, below target, which is something I often do as a trader. Also please be aware that I am not a fundamental stock analyst. Due diligence is your responsibility.


