Sometimes my charts get noisy with all the moving averages, momentum indicators, volume, different time frames, inter-market ratios, etc. For this post, some very quiet monthly charts. Let’s start with the sector that just gave us a bull signal (for the economy, if not the stock market), the Semiconductors.
SOX is above critical support, which long-time readers will recall we managed in real time (incl. an NFTRH+ highlight on Intel) as a resistance breakout back in 2014. Support has been tested 3 times now. Target #1 is in the books and target #2 (an objective, not a directive) is still “out there” (according to agent Mulder and according to the ‘low to breakout’ measurement).
Without the fundamentals that may be coming into play, this is just a chart and I repeat to you that anyone selling you viewpoints based solely on charts is selling only half the story. So here in the land of hybrid analysis we will wait eagerly for the book-to-bill data for May to see if March’s improvement and April’s stellar numbers can become a trend.

NDX channel busted up, found long-term resistance and then thought better of its enthusiasm. I’d have liked to have seen a higher high before the inevitable pullback if I am a bull, but whatever. NDX has what could be a topping pattern (as does SOX above), but patterns are just patterns, which means they are nothing until they are actualized.

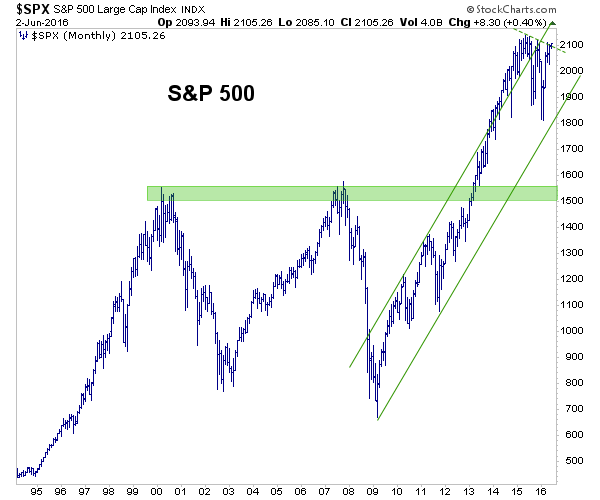
SPX looked oh so appetizing for a drop to the 1500’s. Indeed, for some reason I still hold my unleveraged short on SPY, but it is against several bull items and is held more out of stubbornness than anything else right now. It’s not so much the technicals that are bullish (TA is about as neutral as you can get on SPX, though there is that topping pattern again), but that Semi data. If I’d have fully acted on it in 2013 I’d have made a lot more money. Instead, all I did was avoid damage in the gold sector and only lightly participate in stocks.
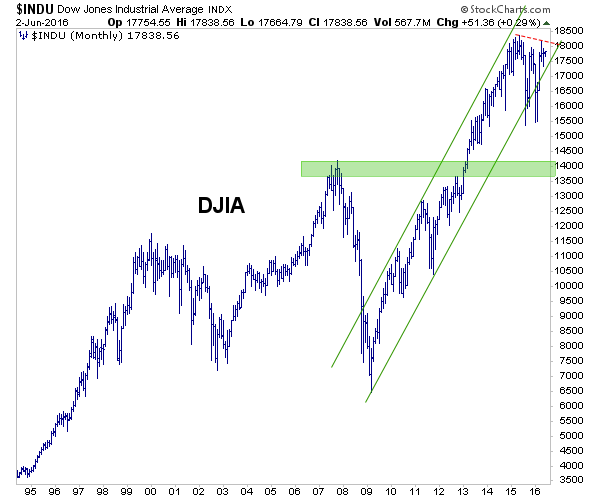
Dow is hanging around below 18,000 awaiting instructions. 14,000, like SPX’s 1500, would be a pleasurable experience as this era’s new batch of momos, bubble heads and casino patrons get flushed, but so far no dice.
Russell 2000 is ugly to me because when I first started investing back in the 1990’s, my financial advisor had me heavily in small caps (for some reason). They under performed and under performed some more while NDX, SPX and Dow went straight up. I’m like ‘what is this crap?’, and then the whole mess resolved into a 50% haircut in my portfolio. In 2002 I took over my own fund management and the rest is history.
But I digress, “this crap” tested its 38% Fib retrace level earlier in the year and that qualifies as a real correction. But there is better support at 850 and that is still an ugly looking pattern, so… nothing is resolved here yet.

Thus ends this journey down Big Picture Lane. The markets are at a very interesting juncture and everybody’s got cool looking charts these days that can make you think whatever a chartist wants to superimpose on a bunch of grids and lines.
When I first started writing, there were relatively few people running charts publicly, at least for anything more than making fundamental articles look more interesting. Now every jockey out there has got anything from a free Stockcharts.com account to some really whiz bang dynamic software.
But the story has not changed; the market is its own animal and much though man and machine may try to quantify it, the animal is untamed.
Subscribe to NFTRH Premium for your 25-35 page weekly report, interim updates and NFTRH+ chart and trade ideas or the free eLetter for an introduction to our work. Or simply keep up to date with plenty of public content at NFTRH.com and Biiwii.com. Also, you can follow via Twitter @BiiwiiNFTRH.