A technical update using daily charts for those micro managing the daily moves and shorter-term trends. Fundamentally, I like that the stock market and crude oil have reversed downward today, but one in-day reversal there does not change recent fundamental discussion just yet. But it is reflective of what would need to be happening on a sustained basis for me to get aggressively bullish the gold sector.
GDX is at a trend line but the key resistance is just above it at the now down turned short-term moving averages (EMA 12 & 20). Today’s rally is nice, but the daily trend remains down. Yet it is only with a loss of the 50 day averages that the correction would be indicated to be something deeper and more sustained.

GDXJ is in the same boat.

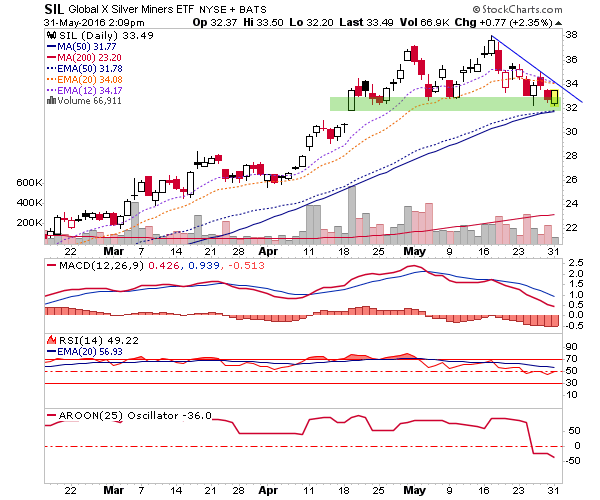
SIL can still be viewed as being at support but its resistance is also at the down turned EMA 12 & 20, which meets the trend line.
Short-term trends are down, intermediate trends are still up with these items above the 50 day averages.