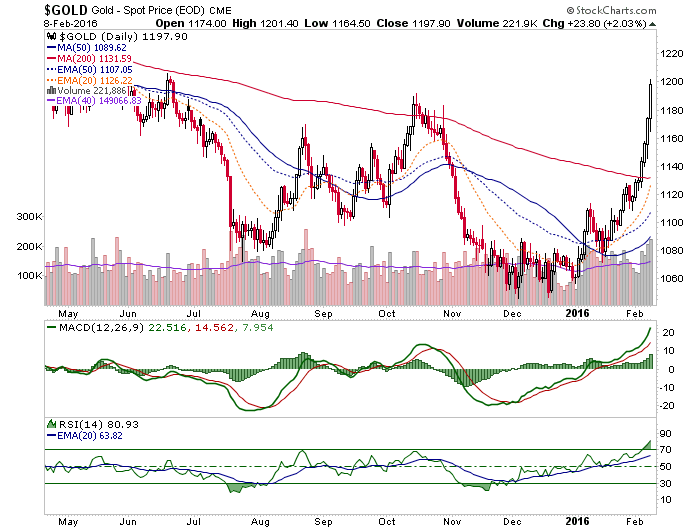
Gold is doing this. Pretty impressive, isn’t it?
Gold is also doing this…

In other words, it is not doing anything we did not already plan for. I don’t want to make light of it because gold is my favorite item for the times (as fundamentals come in line for the first time in the bear market) and I think 2016 is going to bring us some big changes. But that is exactly the point; there will be plenty of opportunity out ahead.
I wrote several times during the bear market that we would not be the first to call the bottom because only a charlatan does that (over and over again in many cases). As also noted along the way I held my long-term gold position through the entire bear market because I saw it as a value and insurance instrument every step of the way. It’s funny how in the real world you don’t want insurance to be needed, but in the gold sector some sort of bizarre alternate reality takes over and makes otherwise rational people run on pure emotion. Enter the pitch men who play these human heart strings all too well.
Our worst downside target was 960. Gold got within 85 bucks of that and as noted in December, the risk vs. reward (limited downside risk vs. significant upside potential, a far different thing than a bottom ‘call’) was in gold’s favor…
A Positive Big Picture View of Risk vs. Reward
But where are we at with respect to those who want in and are afraid the metal they’ve waited so long for is going to run away from them?
Where we are at is… let’s take a deep breath! Buy value when it pulls back or buy a bit now with plans to add pullbacks. I am doing no buying, due to the above-mentioned long-term position. At some point the move is going to stall and the price will pull back.
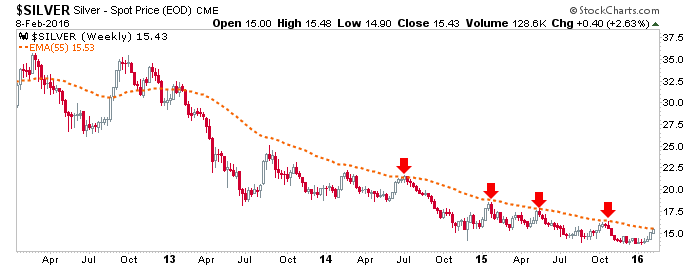
Here is silver weekly, just under the bounce target of 15.50. It remains in a downtrend.
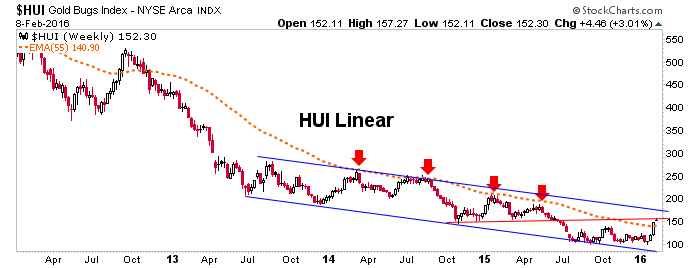
Here is HUI weekly (linear), at the red neckline.
Here is HUI weekly (log), at the channel top.

Here is HUI daily, with yet another impulsive lunge upward today.
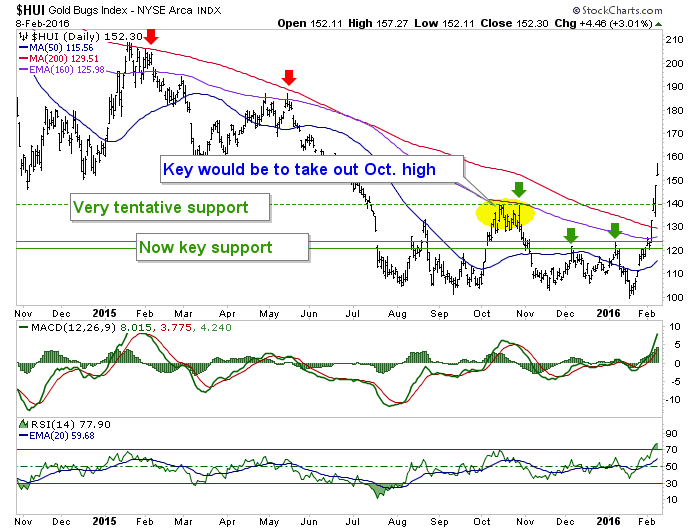
Big money is buying the miners (ref. the GDX volume we noted the other day). But the impulsive move will stop somewhere and by the looks of the over bought readings, it should not be too long. This is not a chart you want to chase if you can help it.
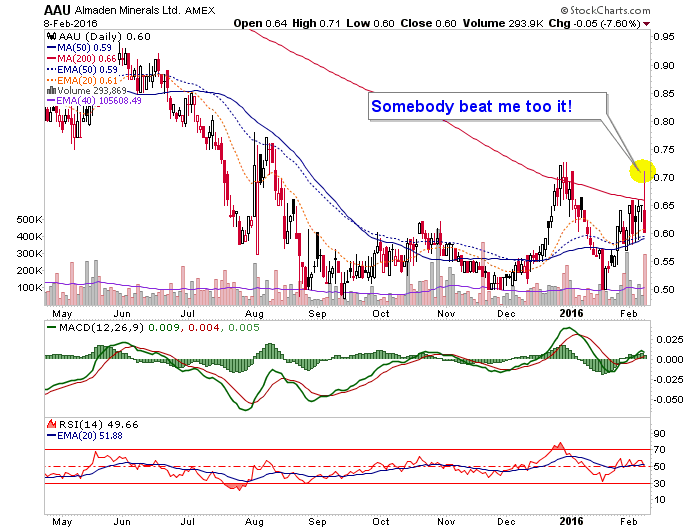
I suppose one can buy individual miners that are not over bought, although I would be careful right now. Some of these things are not over bought for a reason. But in that regard (and I am not recommending AAU, mind you, just relaying an example) I was up handily in my AAU position today, but had a very time committed day outside of the markets. I intended to sell it to take the profit but when I got back, this. Had I sold it I’d have probably bought it back again 12% lower!
I did sell LSG, with a little remorse and a lot of profit.
This is the game folks. There will always be opportunities (to buy and to sell) and it is patience that gets us to those opportunities not having out thought ourselves. Gold and gold stocks are getting over bought and a reaction will come. It’s just a matter of when.
But the great news is that this looks like the start of something. Don’t worry about the impulsiveness being terminal (ref. silver in spring of 2011) because it is a launch, not a flame out. The difference between the two conditions is that a launch is the thrust needed to get a potential bull market going and a flame out is a bull’s final move, carrying late stage momentum players to their fate.
When a pullback happens, we will then chart support levels. That of course would be pending fundamentals remaining on track and all the other aspects of the market spectrum, especially gold’s technical status vs. developed stock markets. Here is gold vs. 4 major items at today’s close. Looking good.


