Using the SPX daily chart as an example, I want to focus in on how I am seeing the short-term breakdown in the market. As you can see, SPX has lost the key support level at around 2000. But I have left the horizontal lines green because I am interpreting it as support that is being broken, but not yet confirmed lost.
What we want to watch for is weekly close below this level or recovery above it. The latter event would be a whipsaw and hold of support. SPX is filling a little gap from early October today. That may have been the mission of this latest drop.
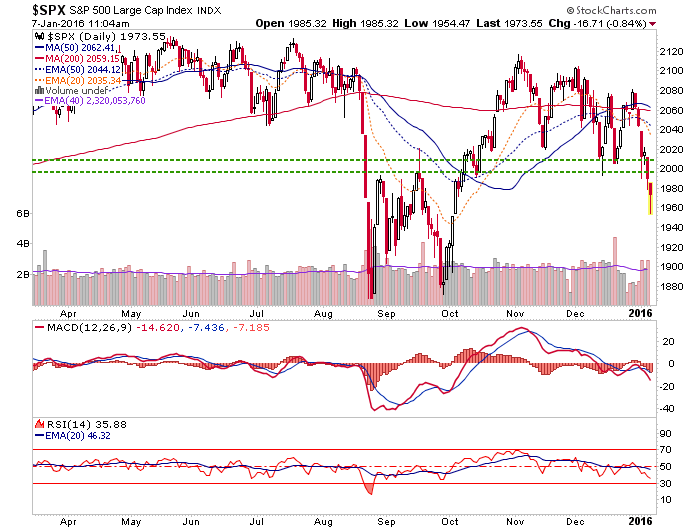
The bottom line is that this market is bearish, but it is a weekly close below support that would further the bearish case. Either way, it is probably wise to wait for a bounce either from current levels to 2050-2065 or from 1875 to current levels (i.e. 2000 area resistance, as it would then become) before aggressively shorting (if applicable) in my opinion.
Also please be aware that I am not managing day trading here. I am managing what I think are changing trends in 2016. i.e., there will be plenty of time to increase bearish positioning on bounces if the trends change.