Amidst an economic backdrop in the US that continues to very gently decelerate, we have a celebration of what was perceived by the market as a dovish Fed.
Anxiety had been rising about a coming Fed Funds rate increase because after all, 1 to 30 year yields had been rising all along the curve and humans being what we are, the trend was extrapolated in the media and in investors’ fears.
So some words taken down by a stenographer sounded as if the Fed is currently dovish; big deal. The Fed will follow economic signals and inflationary signals, and thus far they are slightly easing and bouncing, respectively. Here is the week’s data so far…

Since various indexes broke the ‘swing’ to the upside, the picture has been short-term bullish, obviously. I think that with the noise in the background (where for one example it is perceived as bullish for the economy to be flat lining because it keeps the Fed on hold) going by the charts is as important as ever now. Let’s review some.
RUT weekly chart is discussed in a public post from last night. Here is the daily. The dotted line is still red because I am calling it resistance until it makes a weekly close above 1220. The break from the Diamond theoretically implies new highs as RUT exits consolidation for a new leg up.

SPX is similar with respect to its new highs. A weekly close at current or higher levels makes the dotted line support.

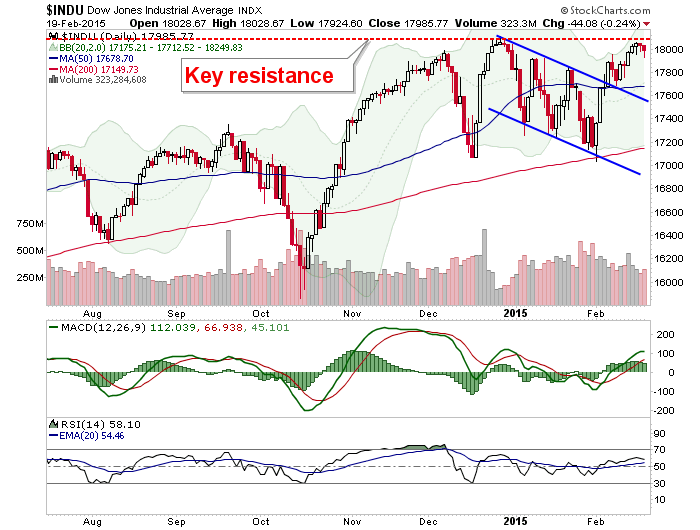
Dow is conspicuous below resistance.
SOX has an implied target of 750 off of the Handle breakout. Turning the current level to support would be key to that view.

NDX is the one that is really putting on a show. It has turned 4300 to 4350 into a support area. The target is noted.

Do you see all the green on the Bank Index? Every one of those green things was red 3 weeks ago when this chart was originally reviewed in NFTRH 327. BKX is bullish above the moving averages.

Euro STOXX 50 hit new cycle highs yesterday and remains bullish.

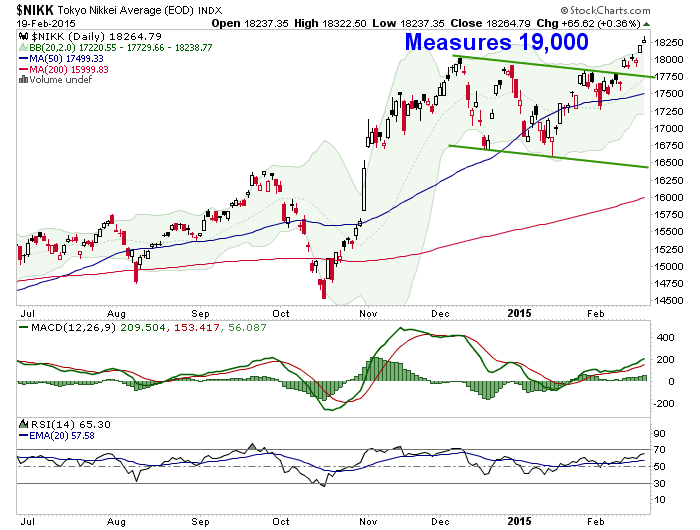
Japanese Nikkei is bullish for much the same reason as Europe; that would be the none too subtle signals given to the stock market that policy makers “will do what we must” to boost asset prices (under the guise of fighting deflation).
There is no negative divergence currently showing up in Junk Bonds or Junk-Quality spreads. The implication is that risk remains ‘ON’.

‘Inflation Expectations’ Gauge TIP-TLT remained above the MA 50 yesterday, despite some rough going in the ‘inflation trade’, i.e. various commodities.

Gold dropped to a ‘higher lows’ trend line. That’s the only good news. The bad news is that it dropped below the preferred level (to a short-term bullish case) of 1240-1260, below the MA 50 and below the (red dotted) neckline. The still-bearish CoT (as of Feb. 10’s data cut off) has not helped.

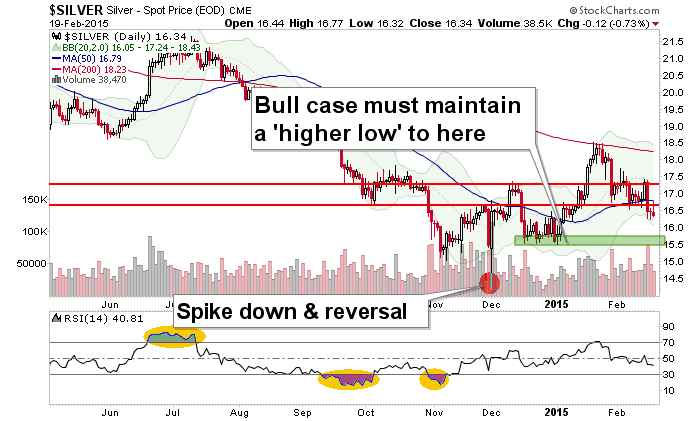
Silver has created a new resistance level and is bearish below the MA 50. Period.
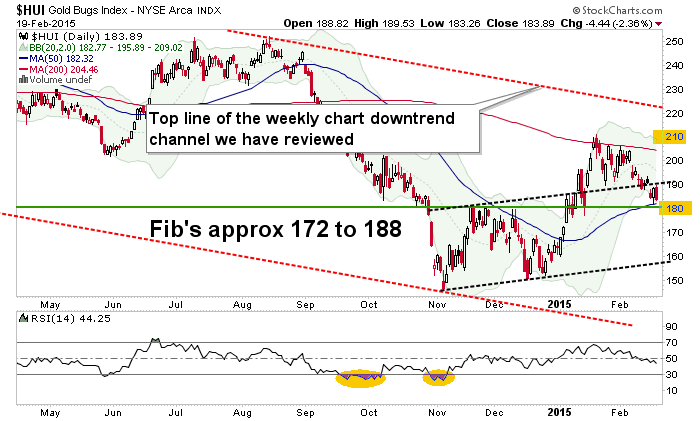
HUI is status unchanged. The preferred support level has been 180 and HUI just about got there. But the Fib layer extends down to the low 170’s and also a higher low around 160 (+/-) cannot be ruled out.
10yr-2yr yield spread is adversarial to gold. That’s an important fundamental that gold bulls continue to ignore.

Another negative is, with reference to the bullish daily BKX chart above, the Banks’ inverse relationship to gold. BKX held important support and as of now, still looks good.

Bottom Line
The preferred macro backdrop for the gold sector appears to be slowly engaging. That would be global economic contraction, including in the US. But the gold sector’s fundamentals are dragged by ongoing confidence in policy making (as evidenced by the tame yield spread among other things) and gold’s continuing bear market as measured in various stock market units. It is stock markets that are benefiting from inflationary policy.
As for inflation itself, TIP-TLT has risen and commodities are bouncing. As the gold sector eases, this should be final proof of what we have noted all along; that gold is different from commodities and that inflation should not be the only key to one’s investment orientation with respect to gold.
Stock markets are what is bullish. This should not be surprising since it has been a trend for so long now. This trend continues to fan out from the US to certain global areas that are able to leverage currency devaluation for asset market appreciation.
In looking through the various charts (many of which are not included above) I get the feel (the analysis will continue to go by what is, not by what one human feels) that stocks could be entering a last hurrah! stage. That would be a blow off scenario. Within this there could be short-term peaks and corrections, which as the recent ‘swing’ market proved, have been beneficial to resetting over bullish sentiment to keep the bull going.
Dialing out to the bigger picture, the gold sector is inverse and could be the next big play. But next plays do not start until current plays are done. Let’s maintain balance and patience as we head toward spring time. Spring time? Did I just write that? I’ll still be seeing snow in my yard in June.
See you Sunday with NFTRH 331.